You may have tried Adobe Illustrator or Photoshop in the past and found the daunting learning curve to be very steep. Now there is a new product from Adobe that is simple and easy to use in a browser-based interface. No software downloads are required to use Adobe Express (AE).
Students can open and complete the assignment in Adobe Express online and submit them through Canvas. Instructors can view, grade, and leave comments on Adobe Express submissions using Canvas SpeedGrader. Students and instructors can launch their Creative Cloud Apps through Canvas with Duo).
Instructors can quickly create content for their Canvas courses and use visual prompts for starting discussions. Express presentations allow you to assign engaging visual projects and presentations.
For student projects, there is a library of images and templates to help them get started quickly creating visual assignments or infographics.
Adobe Express Presentations (formerly known as Spark) is similar to Google Slides. Instructors can ask students to lead a discussion on a particular topic using an Adobe Express Presentation.
When instructors offer choices to students in how they interact with and consume content (i.e., when you present images and text to convey the same information), you are engaged in effective Universal Design for Learning strategies. Try assigning students media projects by creating images, posters, and videos that can be posted directly into Canvas Discussions for asynchronous peer review opportunities. Given the opportunity to be creative, students will engage with the content more deeply.
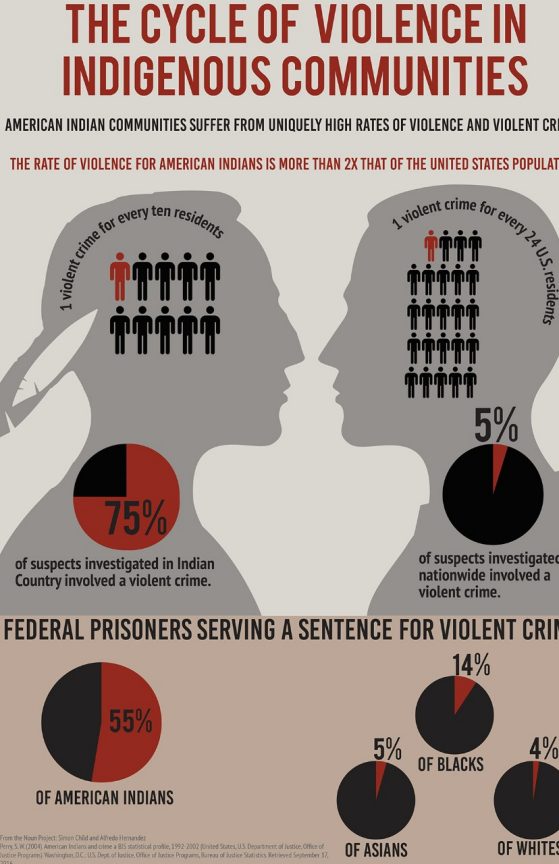
Infographic Project Example :
Project description: Use hierarchy, scale, color palette, and typography, to contextualize your thesis statement.Use graphics to help you convey your statistical research.
- (3.5 hrs) Research a topic that has been assigned or chosen, gather reliable data, and sketch out six concepts for your infographic. Share with your peers and receive feedback to improve your concepts from the class to select a concept to continue with. For more guidance, review this strategy for step-by-step directions.
- (30 min) Review the project rubric and discuss how you can create a visual framework, using graphical assets from The Noun Project, in your infographic. Examine this student sample, and note the image within the opposing faces. This creates the visual comparison which is at the heart of the infographic: crime in indigenous communities is more pronounced than other communities in the U.S.
View the full project description is here.
Infographics allow students to visually depict data in creative and engaging ways. Communicating visually is a 21st century communication skill that is important for students to develop. Adobe Express makes it easy to visualize projects without getting bogged down with time-consuming software applications.
If you are interested in learning more about Adobe Express or designing a media project, complete this consultation request form and we will schedule a time to meet with you.
You can also watch an Adobe Express workshop presented by U-M Information and Technology Services (ITS).