
Festifall certainly looked and felt different this year. For QMSS, it was our first Festifall so we were excited and ready to take it on. It was great talking to all the U-M students who wanted to hear more about our program; either to join with us this semester, or to consider how knowledge and experience with Quantitative Methods could enhance their U-M experience and their skill set after graduation. Thanks to the students who ‘stopped by’!
We hope you learned something about us at Festifall, but we also learned something about you. We heard that there is interest in having a QMSS student group in addition to the academic course of study we offer. We were very excited by that feedback, and would certainly be thrilled to work with a group of students putting this together. We’d love to hear from more students who would like to form or join a group like this. Contact us to help start it up, or just to get on a list!
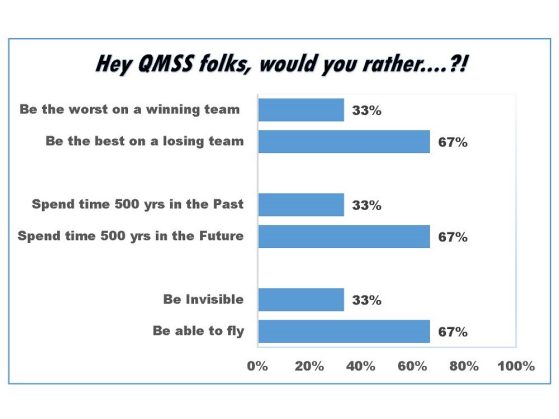
We didn’t just talk business at Festifall though. We had a little fun with our visitors, too! While getting feedback on a few tough questions, we discovered that U-M students are diverse in their preferences, but among those who are interested in QMSS, there is a tendency to want to be a flying, future-traveling high achiever!!!
***Now that you’ve seen the info above, how about a little critique? Because after all, as a member of QMSS, I can’t pass up an opportunity to teach about responsible use and presentation of information!
The sentiment of the summary was right on! We are a new program having our first outing at Festifall, and we are grateful to those who expressed interest! But the person who wrote this up (me) did have a purpose in talking about Festifall. I wanted to put our best put forward and get others to share in our enthusiasm about QMSS. So did I perhaps take some liberties in my discussion? Did I let my desire to ‘market’ the program sway me into making statements that, while true, give an exaggerated impression of the circumstances? I think I might have, and I’ll point out how!
In the end, the lesson here is that when reading any report of data, you need to consider the agenda of the presenter! And when you, yourself, are the presenter, you must hold yourself to the standard of being true to the story your findings tell.
Now, how did I go astray?
- In the first two points, my spin lay in the language of my discussion.
- I put a positive twist on the level of participation we had from students in Festifall. But honestly, I don’t know if the participation was good or poor because I don’t know how many people visited rooms for academic programs (as opposed to student orgs) during this year’s highly unusual Festifall.
- Next, I rallied around the idea of a student org for our department, implying that there was a critical mass of enthusiasm for the idea! We did hear from a couple of folks that they would like such a group, so our statement was technically true. But that group was just two people (which we still think is enough to create a spark for a great idea).
- Most importantly, my spin was in the presentation of the statistics. I gave you some data on our playful quiz. It sure is interesting to see how overwhelming the support was for flying, and for achieving, and for the future! And it sure was interesting that the breakdowns for all of these ‘would ya rather’ questions was a 1/3 to 2/3 split. The breakdown was the same for each question! Look a little more closely though. Is there something missing in the chart? You bet there is! I did not include my sample size! I did not reveal that the percents were based on only 6 responses to each question, a sample size really too small to be discussed in terms of percents for this purpose. Giving counts would do the job and be more true to the meaning in this data! 4 folks want to fly, but 2 others wouldn’t mind being invisible. While technically identical, that tells what I know much better than reporting the 33% v. 67% comparison with no N provided.
- As far as invisibility goes though, one thing we should take away from this is that we should be wary of any chart or statistic that makes its sample size invisible. No QMSS student would ever do that! They would know better!